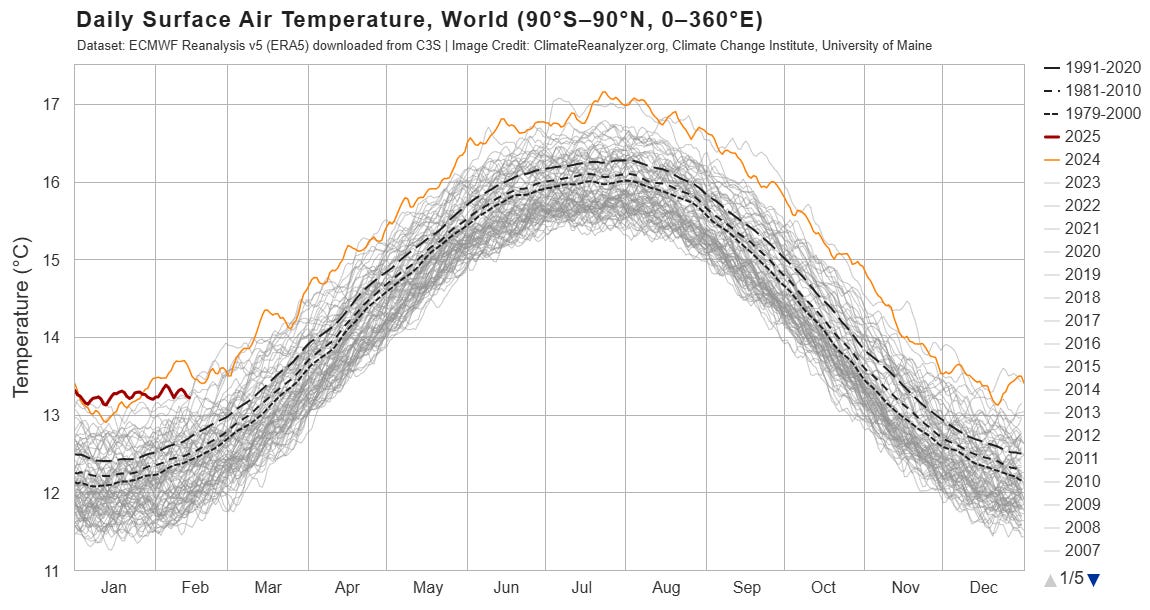
This graph shows the evolution of the global average temperature each year over the past 20 years and the averages for 1979-2000, 1981-2010, and 1991-2020. 2024 was the first year to exceed 1.5 degrees above the pre-industrial average (1850-1900).
Yes, we experienced an El Niño in 2024, and the 2022 underwater volcano eruption Hunga Tonga–Hunga Haʻapai still had a warming impact. Additionally, reduced sulfur emissions from maritime transport also contributed, but it is easy to see that 2023 and 2024 are anomalies compared to the past.
So far in 2025, as the red line highlights, a La Niña year, it is cooler. We will very likely have another El Niño in the next 3–4 years, and it is likely to be even hotter than 2024.
In North America, we have experienced a sustained cold period since the beginning of 2025. Some attribute it to a slowing of the Jet Stream. The map below shows the temperature anomaly compared to the 1991-2020 baseline on Valentine’s day; extremely cold in North America, extremely warm in the Arctic. A warming of the polar region reduces the temperature difference between the polar region and mid-latitude regions which disrupts normal climate behavior.
Climate change is not over, it has not been eradicated by the US election. Since carbon emissions could reaccelerate in the future, climate adaptation will come to the forefront.
How could climate change manifest itself :
Longer lasting extreme weather patterns: extreme drought in California leading to the devastating fires in L.A", extreme cold fronts East of the Rockies since the beginning of 2025.
Expansion of arid zones (Western USA, parts of the Mediterranean)
Glaciers melt (Himalaya, Andes) leading to extreme flood followed by future lack of water
Heatwaves in urban areas (South Asia, Middle East) with temperatures over 50 degrees Celsius
The economic impact will be felt through infrastructure costs, insurance costs and productivity loss. Insurance is becoming a more significant topic.
.


